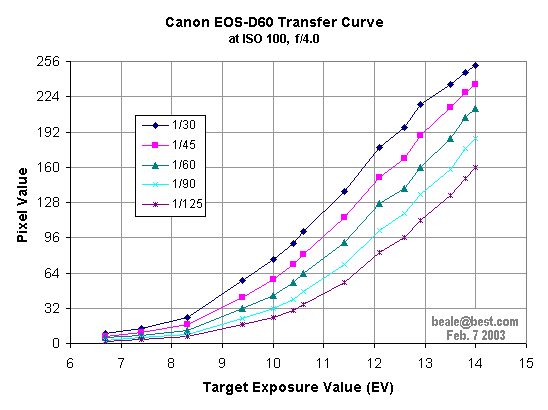
Response Curve of Canon EOS-D60 digital camera
by John Beale, Feb. 7 2003
This graph shows the camera's response in pixel value (intensity measured
from 0 to 255) for a given target luminance as measured in EV with a Sekonic
L-508 spotmeter. The images were taken with a fixed sensitivity of ISO 100,
and a fixed aperture of f/4.0, with different shutter speeds from 1/30 sec
to 1/125 sec. The camera appears to have a dynamic range in excess of 6 f-stops,
but exactly how much depends on how you interpret the left end of the graph,
which trails off smoothly towards the 0 pixel value at low illumination levels.
Small features will be increasingly obscured by random sensor noise
as you move farther to the left on the EV scale.
I believe the true curves are very smooth. The graphs of measured data show slope changes only
due to the finite +/- 0.1 EV repeatability of measurements with the L508 spot meter.
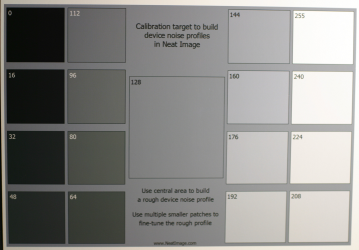
Measurement note: The test target used here is an inkjet print of a
sample file
calibration target from neatimage.com having several uniform grey regions.
The Sekonic L-508 turns out to have more infrared response than expected;
perhaps it uses an unfiltered silicon photodiode as a detector. This is a
problem since the target's black inkjet ink is not as optically dense in
the IR as in the visible, so when using a halogen light, the meter response
did not correspond well to the visible shades of grey. I side-stepped this
issue by using only fluorescent light for illumination, which has almost
no IR content. With a Philips 25 watt compact fluorescent as a light, the meter response
matched well to the subjective brightness of the squares.
Back
to measurements page.