| Test | YouTube.com | LiveVideo.com |
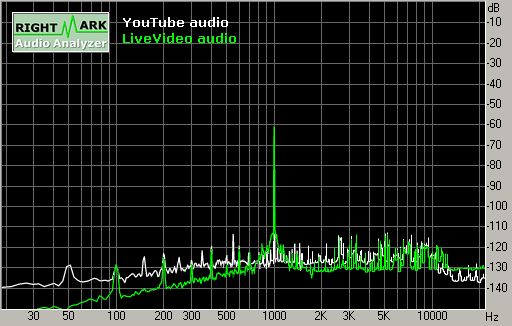
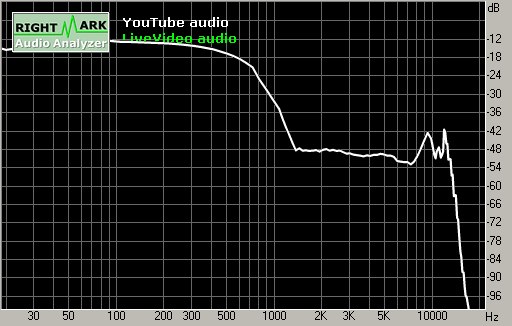
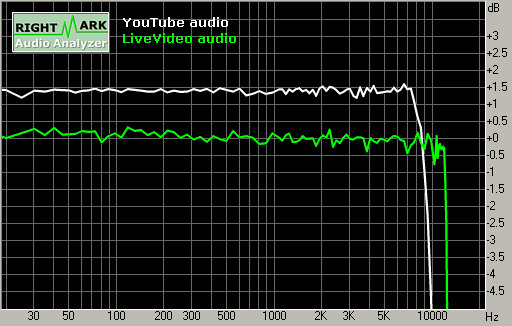
| Frequency response (from 40 Hz to 15 kHz), dB: | +1.60, -83.67 | +0.33, -82.61 |
| Noise level, dB (A): | -400.0 | -400.0 |
| Dynamic range, dB (A): | 95.0 | 96.7 |
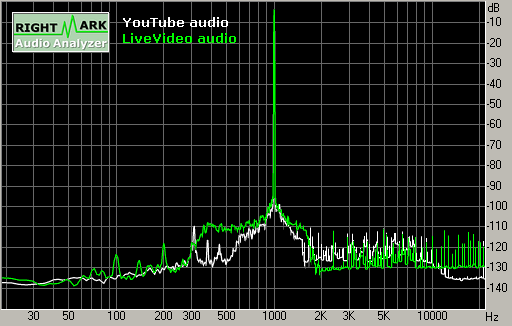
| THD, %: | 0.0006 | 0.0010 |
| IMD + Noise, %: | 0.043 | 0.013 |
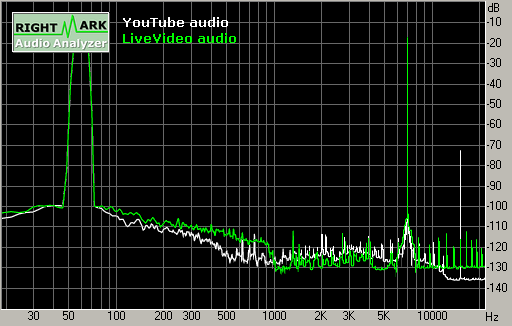
| Stereo crosstalk, dB: | -33.0 | -364.0 |