I was fortunate to have the opportunity to do some tests with Red #103
(firmware #12) on Jan. 8 2008. Careful testing takes time;
analyzing and
understanding the results takes quite a bit more time. I will
add to this page as I am able. There may
be discussion of
this test at Reduser
and DVInfo.
Many of the raw files were taken in 2k 16:9 mode ("Red 2k" at
2048x1152), which uses a cropped or windowed central portion of the
sensor that is half-size in X and Y, so that is 1/4 the total number of
pixels available in 4k mode. Using the 2k mode saves storage
space and processing
time, and is useful for evaluating technical details at
the per-pixel level (noise, sharpness, color, etc). To compare image
quality overall, of course the 4k mode is better. To
open
Redcode Raw (.R3D) files you need an application such as Redcine.
The Red Alert and Redcode Quicktime plug-ins
(as of Jan. 2008) don't support 16:9 format.
NOTE: in August 2014 I had to remove all R3D files after my site was suspended for over-large files. Sorry.
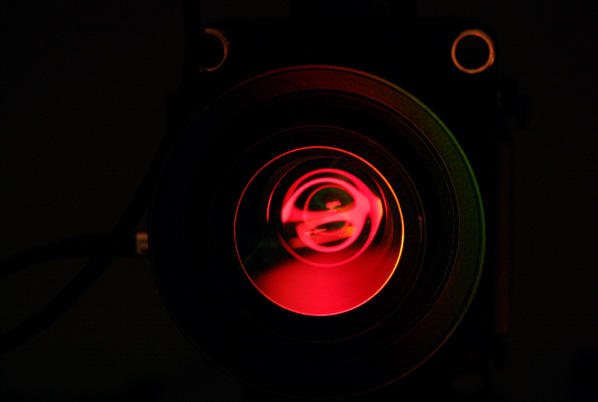
This test shows the dark level of the camera and the
nature of the noise with no light. Since the RED does not have variable
analog gain between sensor and A/D, I do not expect the recorded dark
noise level in the raw file to change with camera settings. On this
camera, ISO/ASA setting and color correction is all done in post, after
the shoot. Just to check this I did another dark clip with
the color temperature manually set to 4200 K. This test was
done immediately after turn-on, indoors at about 25 degrees C.
In the full day of testing the camera became only barely warm
to the touch, but it was mostly in standby and recording only very
brief clips.
Redcine allows export to TIFF or other standard formats with a
selection of RGB color models, exposure and color adjustments. At the
default settings, the dark level sits well above R,G,B=0. For normal
image processing you would adjust it downwards ("crushing the blacks").
Regardless of settings, the noise level appears good to me with very
little fixed-pattern noise. Apparently there was an
improvement made with firmware #12, as cameras running earlier versions
of the firmware showed more noisy dark areas in low-light conditions.
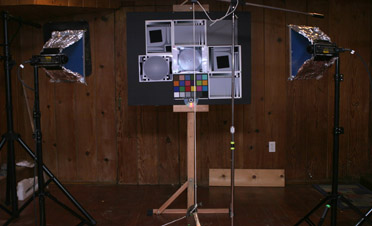
Setup: For the 2k shots the red camera was 8' 7" from the charts
measured from the front
of
the PL mount (the lens extends in front of this plane). The lens was
the Red 18-50mm set at T3, T5.6 and T8. For the 4k version camera was
moved closer and zoom adjusted to frame approximately the same area. In
all tests, focus was by eye, with the lens at T3, using the LCD
viewscreen in 2x expanded view ("Focus Check" user key 2).
Note, in 2k mode, the view magnification is less than 2x. The
main
goal of this test was to examine color response, not
resolution.
The center color chart is the A4 size non-glossy IT8.7/2 from Wolf
Faust at targets.coloraid.de,
charge R060101.
Colorimetric data: R060101.txt
The bottom color chart is the Gretag-Macbeth color checker.
The monochrome resolution patterns were printed by an Epson
Photo
R320 at 1440 dpi on matte paper. The patterns were generated
using
Imatest, and
the specific images
I used can be downloaded here.
The charts are pinned to a black 30x40" foamcore sheet.
Light was from two Lowel
Tota
lights with 650
W bulbs, placed at roughly 45 degrees on each
side. The light stands were 4' 8" from the center of the chart. The
light on camera
right was
gelled Rosco 3202 (CTB), light on camera left was gelled 3202 + 3216
(CTB, +1/8 CTB) to balance the measured color temperature
between
the
two. Both lights were on electronic dimmers to allow for adjustable
color temperature, but in all cases were used with the dimmers set to
full-on. A length of 24" wide black wrap was used
around
each fixture to reduce stray light to the sides.
Incident exposure at center of chart: f5.6 + 2/10 at ISO 320, 24 fps,
180 degree shutter.
Lighting color temperature: 5150 K, CC-4 from left fixture and 5150 K,
CC-1 from right fixture. (CC units in deca-mireds) [units
corrected 4/15/08]
Exposure measured by Spectra IV
(s/n
072664) calibrated 10.3.07 by
Quality Light-Metric Co, Hollywood CA
Color measured by Minolta
Color Meter II (s/n 119859), calibrated
10.3.07 by Quality Light-Metric Co, Hollywood CA
The goal of this test was to examine aliasing with
high-frequency detail, at different contrast levels, with B/W, grey and
color patterns. Lighting was the same as above (Test #2) in this case.
An in-camera manual white balance to a grey card indicated
6218 K, but my grey card is old and probably bad. The Red
display has a "traffic light" exposure aid which has red, green and
blue lights indicating if any area is clipping in the R, G or B
channel. The exposure in this test at which all three clip lights just
disappeared
was T4.0 + 2/3. However, the 2k and 4k shots were taken at T8
in
an attempt to minimize any focus problems. Consequently, the raw image
is somewhat underexposed.
The 20D image was f/8, 1/10 sec, ISO 200. The aliasing on my 20D is so
bad I suspect a problem (Jan.2 2009: there
is a problem). It was once repaired
by Canon, about two years ago (it was writing corrupted images on the
CF). If anyone else
wants to
try this test with a 20D (or any other camera), I'd be interested in
your results.
The background
is 36x48" white foamcore (Office Depot 575514). The uppermost
zone
plate looks
washed out due to overexposure, but it is not. That pattern is just
printed with low contrast
(2:1). The center zone plate has a sinusoidal pattern, the left zone
plate and the bottom colored plates are hard-edged patterns.
The basic versions of these patterns can be downloaded here.
I made the color versions from the hard-edged B/W version by RGB levels
adjustment in Photoshop.
Each of the seven resolution test patterns is printed on US letter
size (8.5x11") paper. Top (light) and bottom (color) zone plates are on
Epson S041568 Matte Double-Sided. Center and left zone plates are
on Epson S041667 Premium Glossy. Right pattern (3x5 squares) is
on Alpha Cellulose 315 gsm soft-textured (MIS Associates / Inksupply
ALPHA-8511-25), this paper has no
optical brighteners. All patterns printed by Epson Photo R320 inkjet at
1440
dpi (except the 3x5 squares were 720 dpi).
Exact materials are listed in the interest of recording
the
details of this test. No commercial endorsement is intended, and no
business relationship exists, except as a customer since I bought the
items mentioned
for the test.
UPDATE
Jan.2 2009: More about my Canon EOS
20D RAW problem (JPEGs are OK, but RAW images show mosaic noise; it
started after a Canon repair for a different problem). The fix is to
use the raw converter DCRAW with the -f option. The DCRAW man
page says only: "-f : Interpolate RGGB as four colors". I
might guess that somehow, the two green channels in my 20D sensor's
RGGB
bayer pattern do not have the same gain? Anyway, it certainly makes a
difference. Here is a 200% crop of the same image converted from RAW,
both with and
without the -f flag. USM was added to show the problem; same amount for
both frames: